

Go with the Snow: Winter Forest Monitoring Results
The future is looking drier, and the trees are taking notice. With climate change creating warmer and drier summers, how can we use forestry techniques to increase snowpack and slow snowmelt for water availability? This question led us at NNRG to create an experiment in practical forestry methods, in collaboration with several partners.
Forestry techniques like thinning and gap cuts (small clearcuts around 0.5 to 1 acre in size) are sometimes recommended to increase snowpack, and thereby increase ecosystem resilience in the face of a changing climate. We wanted to provide local proof of concept that these methods work, and are likely to lead to increased snow accumulation and slower snow melt. We’ve shared some of the planning for this project (which also included an assisted migration component) before in this newsletter, and we’re glad to be able to share some initial findings from last winter’s snow monitoring.
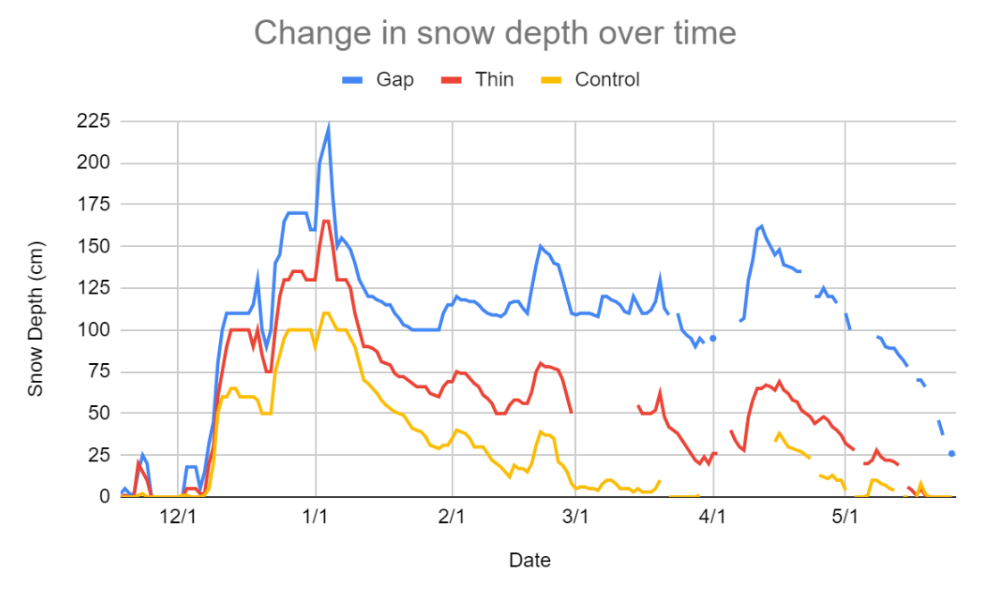
Our expectation, based on similar studies, was that more snow would accumulate in the gaps and the thinned forest than the control (unthinned) forest, where snow would be intercepted by tree crowns and would evaporate or melt more quickly than snow that reaches the ground. We expected to see the most snow accumulation in the gap cut. This expectation was broadly confirmed, as you can see in the figures below. The results showed that significantly more snow accumulated in the gap, and that there was more snow in the thinned forest than the control.
The snow in the gap and thinning also lasted significantly longer in spring – when the snow in the control forest had fully melted, the gap still had about one meter and the thinning had about 25 centimeters of snowpack. Stretching out the snowmelt later into the spring could reduce the impacts of summer drought on trees and increase the supply of cool water to streams.
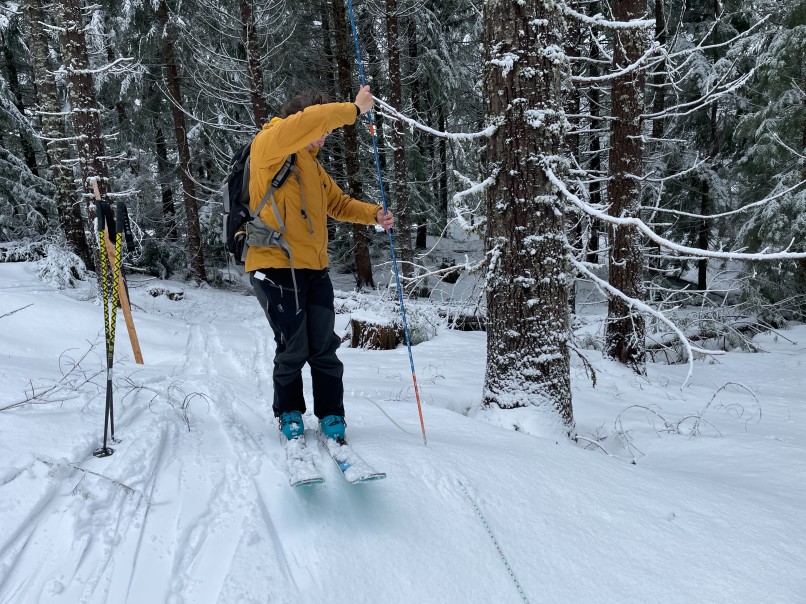
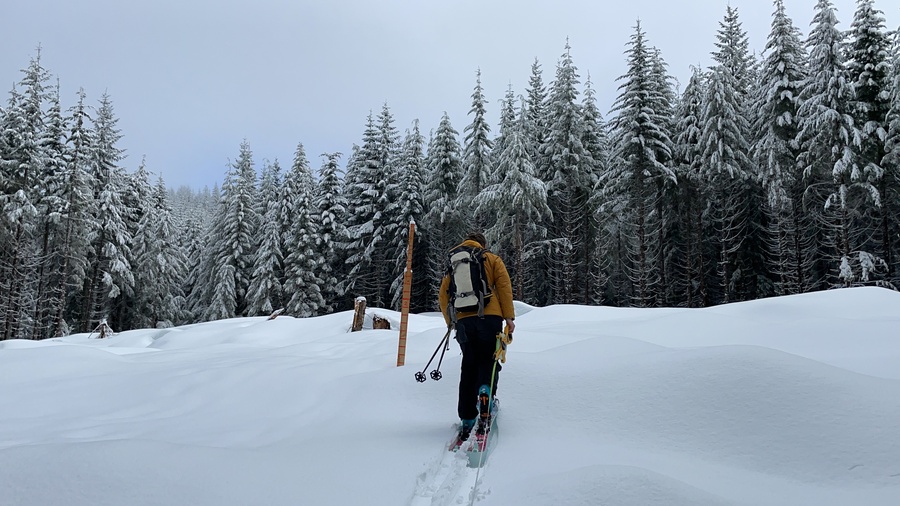
Our team used several different methods to monitor the snow across the three forest types. Before snow began in late fall, we chose representative points along transects through the three forest types. At each of these points we installed a measurement pole and a wildlife camera set up across from the pole, which would capture two photos of the pole each day. These photos were uploaded and used to record a snow measurement for each day.
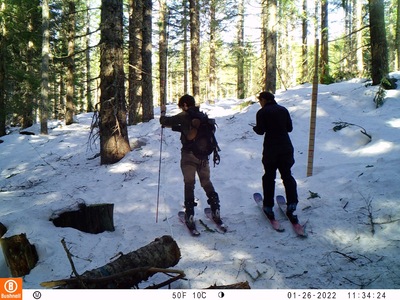
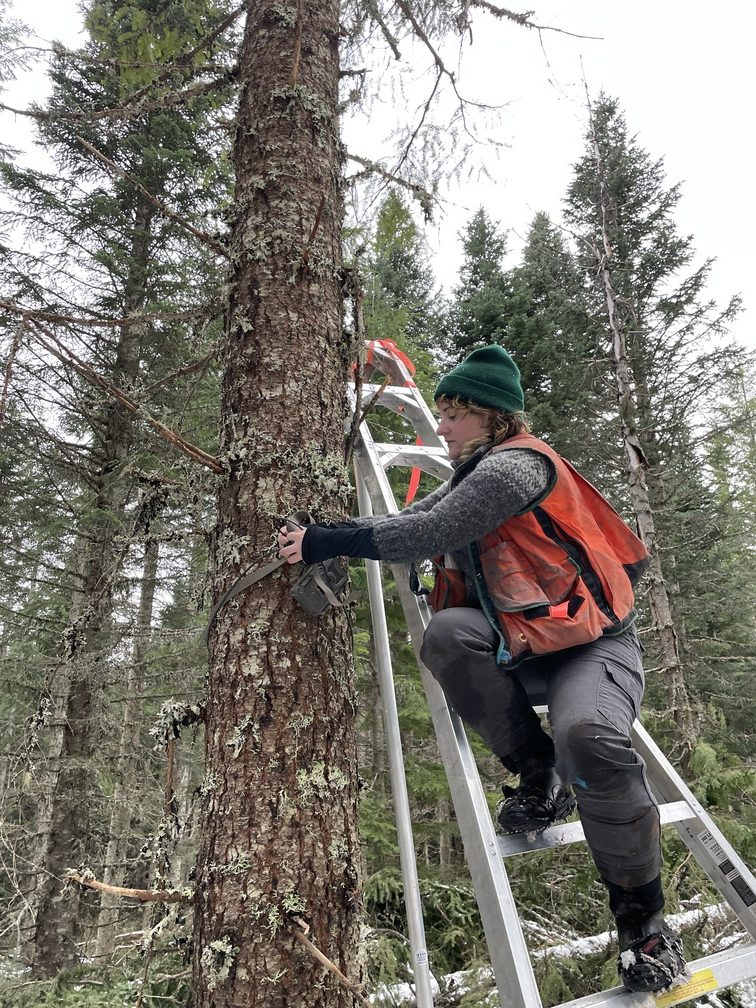
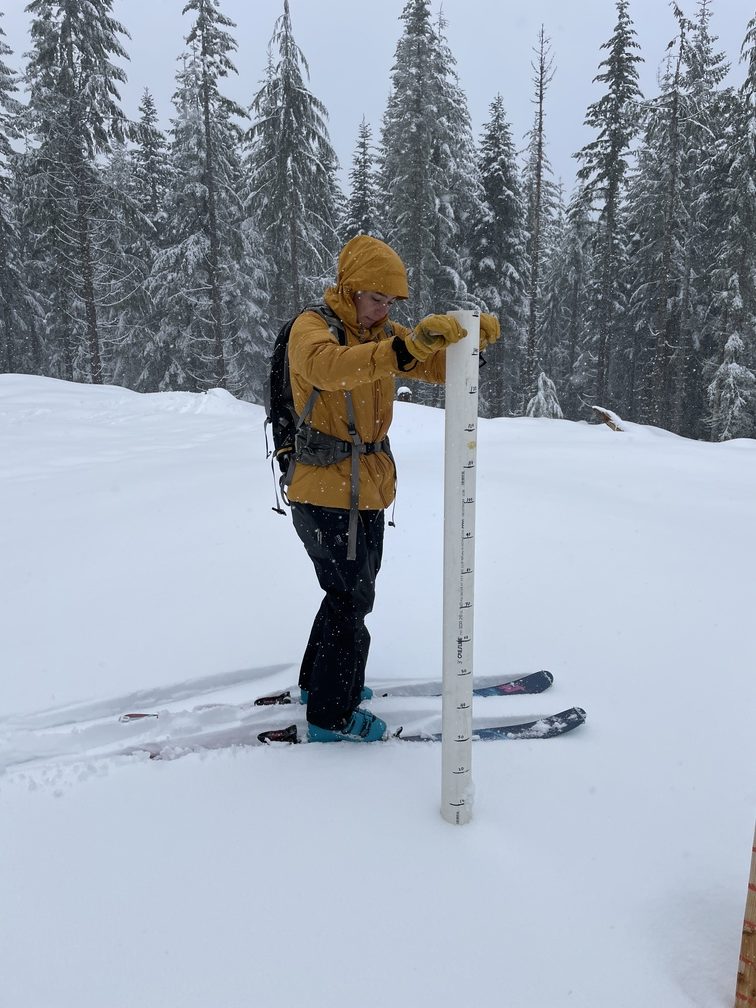
Figure 1 shows the snow depth measurements along the transect through all three forest types, passing first through the thinned forest, then through a gap, and finally through the control plot. This shows that the measured snow depth starts at mid-range in the thinned areas, increases in the gaps, and is significantly lower in the control area.
Snowpack Depth by Date across Transects
- This transect graph was constructed with the data collected on site every other week throughout the winter, and every week during the ablation (snowmelt) period after March.
- While gathering data, technicians took manual measurements of the snowpack with a snow probe at 1 meter intervals along each transect.
Change in Snow Depth over Winter by Camera
- The graphs below were constructed with the daily photos taken by the wildlife cameras. Technicians recorded snow depth measurements by looking at daily photos of the measurement pole and recording that day’s snow depth.
- For each day, two photos were taken. The depth measurement from the clearest photo was selected, as one out of the two was often difficult to read. Gaps in the charts are due to the cameras being obstructed, usually by snow or excess moisture.
While we expected more snow in the gap than in the control, we were surprised by the extreme difference in snow depths between the areas. We’re looking forward to continuing to monitor this site, and hope to replicate the study at a few different elevations. (The sites for this study were at 3,700 to 4,200 feet in elevation). We will also hold several workshops so people can explore the study sites firsthand and learn more about the results. If you’re interested in attending one of these workshops, please sign up for our monthly newsletter to receive the announcement!
Leave a Reply