

To Thin, or Not to Thin
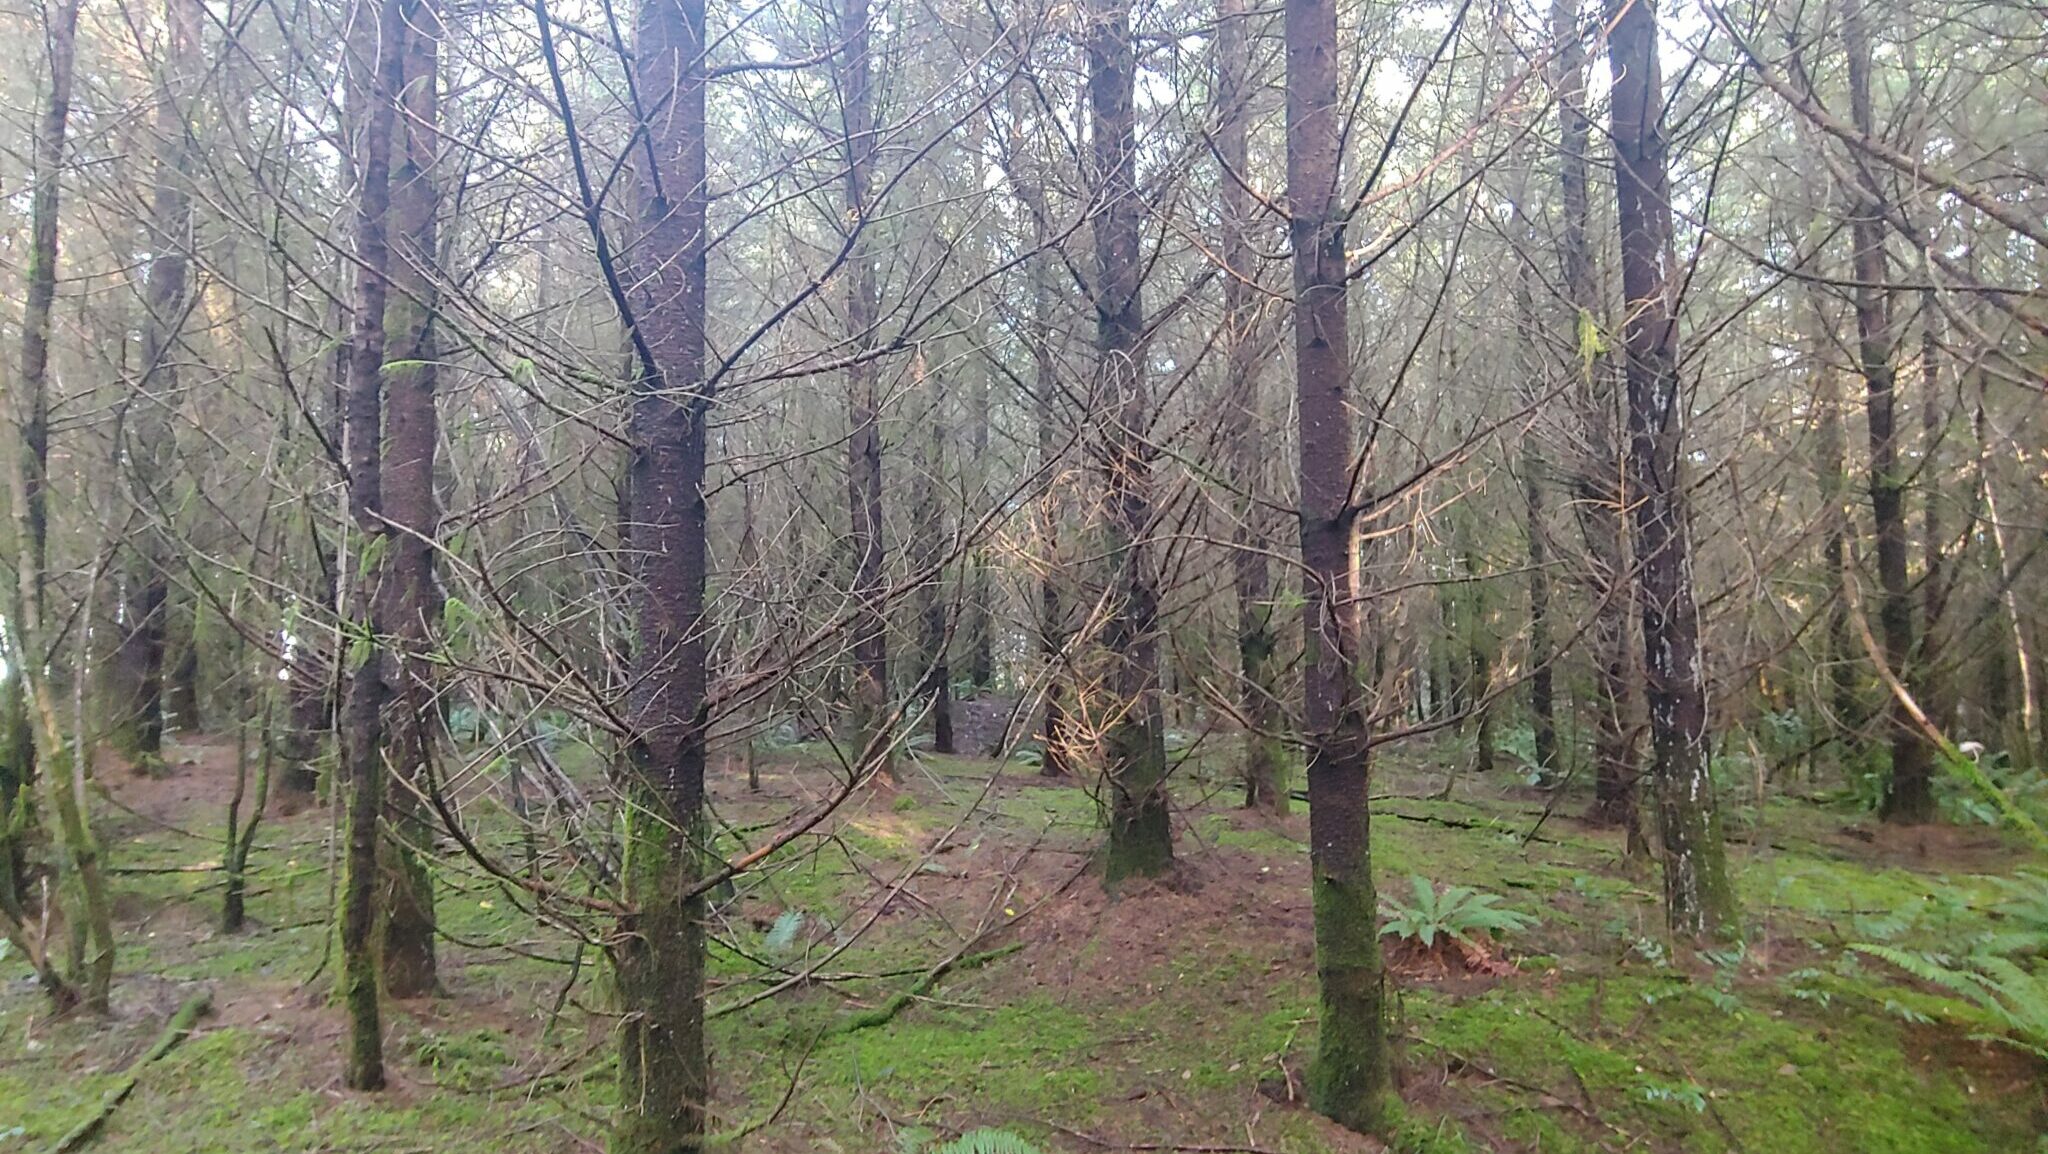
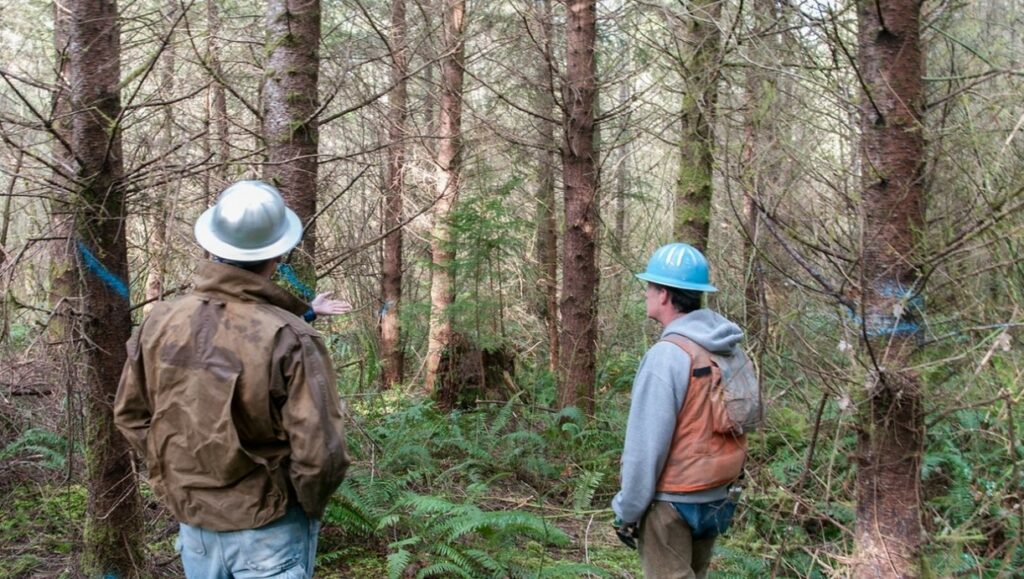
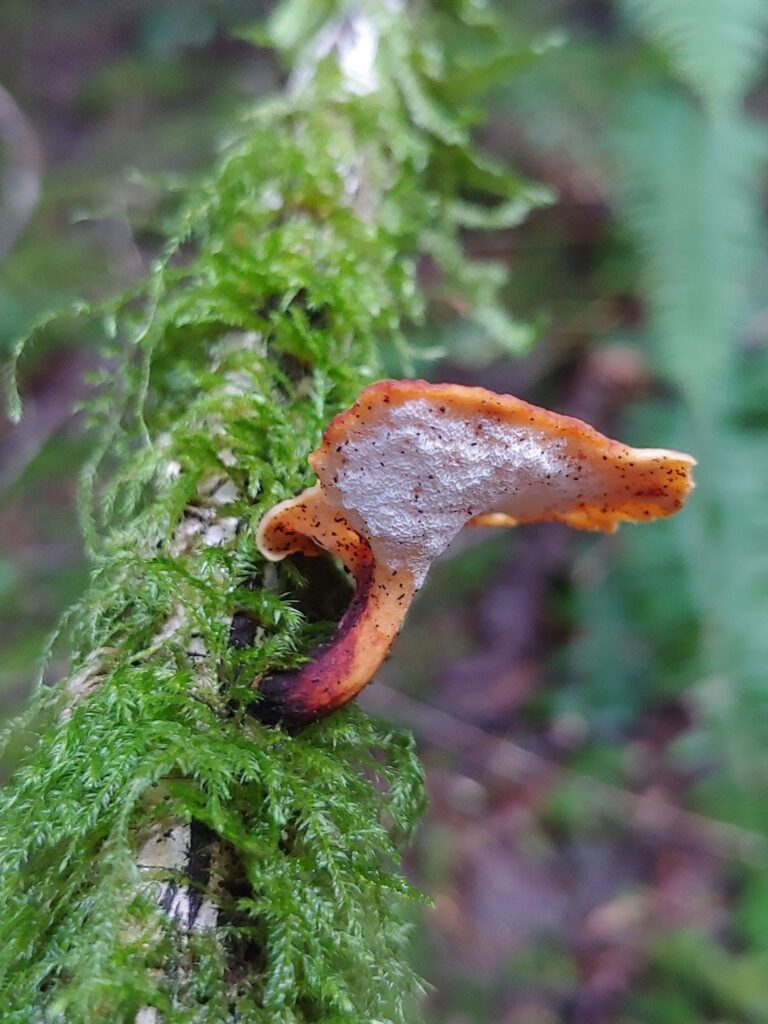
There is a 28 year-old Douglas-fir plantation on my family’s Bucoda tract that was established following clearcutting by the previous owner. The trees have grown into a deep, dark, primordial atmosphere, characteristic of densely canopied conifer stands, that belies the otherwise innocent nature of such a young and artificially simple forest. The individual trees can appear both quite tall, their crowns lost above a blur of dead branches, and quite squat, as those dead branches still connect the tree crowns to the forest floor. So little sunlight reaches the floor, and so little wind stirs deep within the woods, that moss is the sole groundcover and creeps its way up the lower trunks of the trees. The perennial rain of conifer needles and dead branches from above, added to old chunks of wood left from the prior generation of forest, feed a diverse and bewildering fungal community that flourish even during the driest times of the year. For a homogeneous plantation, it’s still a pretty cool ecosystem.
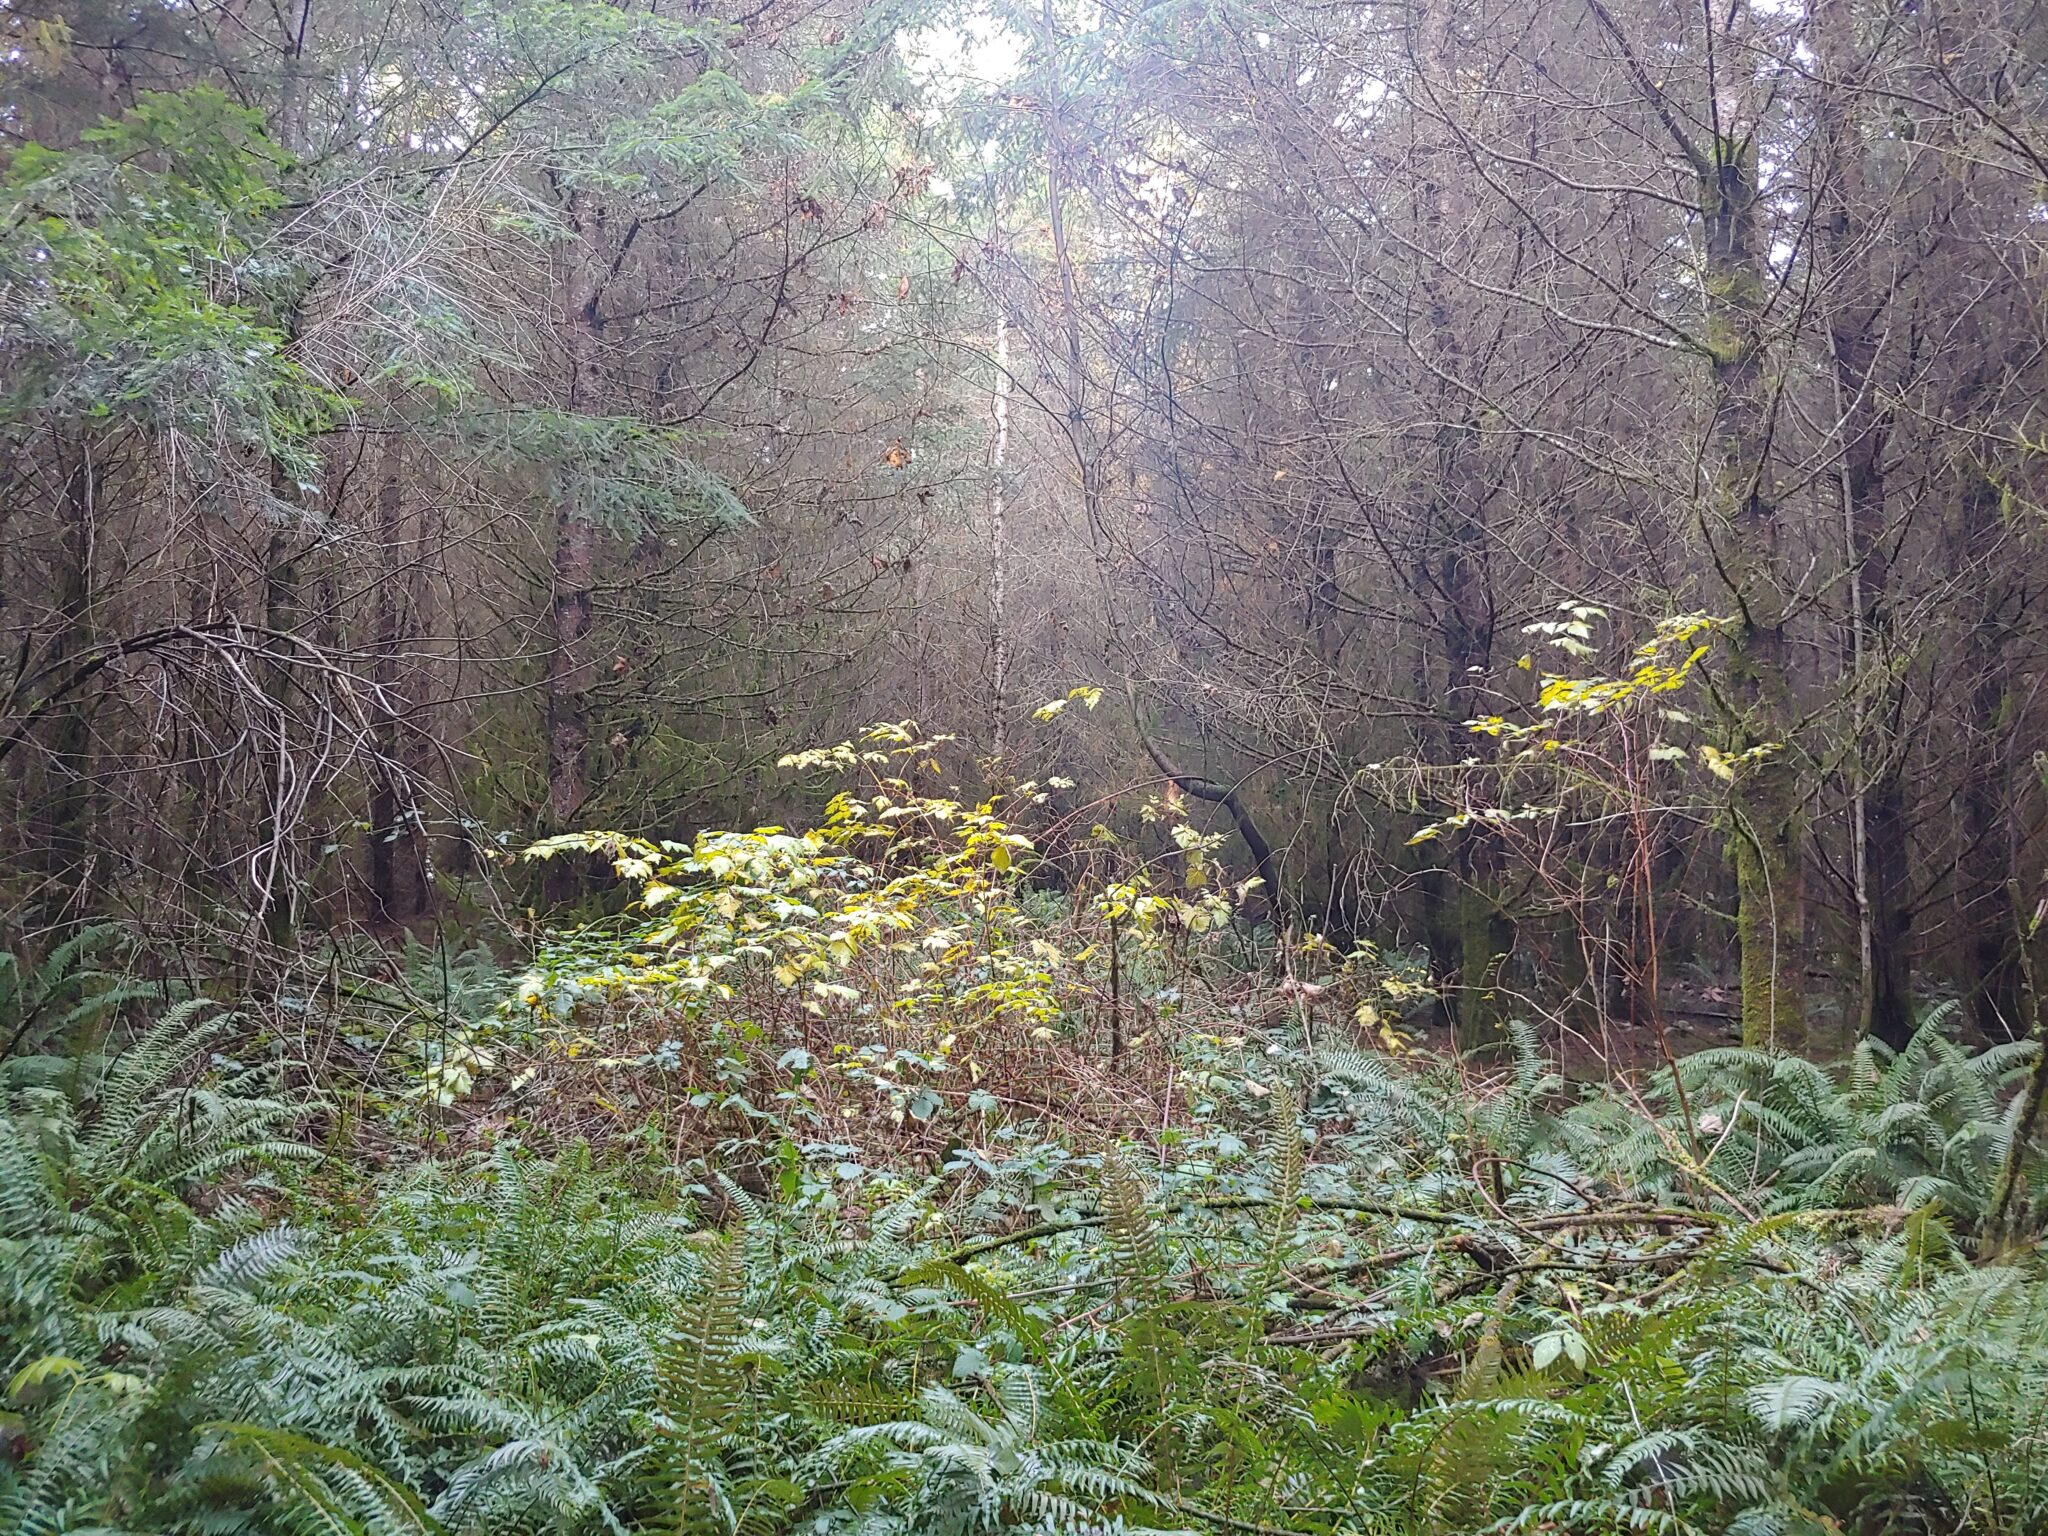
To imply that this forest is devoid of diversity would do a disservice to the power of life to colonize new environments. Sprinkled throughout the Douglas-fir plantation are periodic big leaf maple, most of which sprouted from the stumps of trees cut during the prior harvest. Alder also occurs in small gaps or along former skid trails, and bitter cherry, an early colonizer of any disturbed site in this area, is still hanging on in the tightening grip of the conifer canopy. You routinely pass by small openings in the canopy when walking through the woods, which often reveal themselves by a proliferation of diverse shrubs that crowd together in the available sunlight – elderberry, salmonberry, vine maple, bald hip rose, Oso berry, and others. These gaps are refugia of biodiversity, waiting for the moment the dense conifers opens up and allows them to colonize anew the space around them.
Live Crown & Height-to-Diameter Ratios
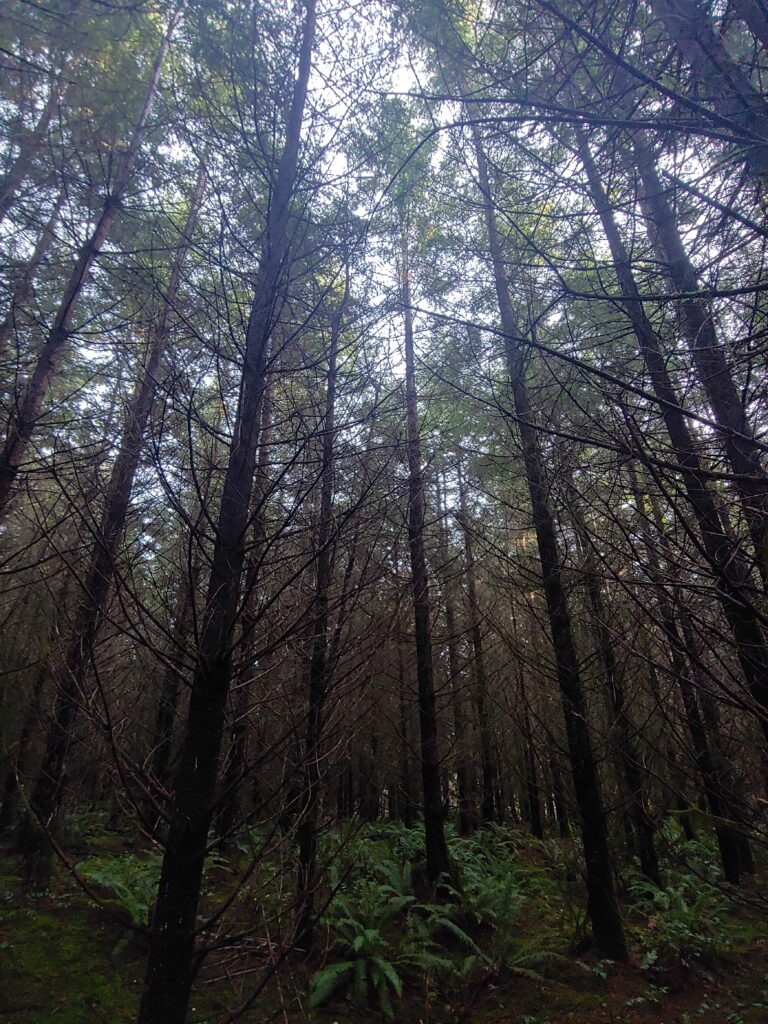
When first walking into a plantation my eyes immediately go to the live crowns of the trees. A tree’s live crown – the amount of a tree’s height in live, green, photosynthesizing needles or leaves – is the growth engine of the tree. In dense stands composed of only moderately shade tolerant trees, like Douglas-fir, the live crowns of the individual trees begin receding, due to shade competition, as soon as the canopy closes across the stand. From that point on it’s an all-out competition between the individual trees for sunlight, and they grow tall, striving to be dominant in the canopy.
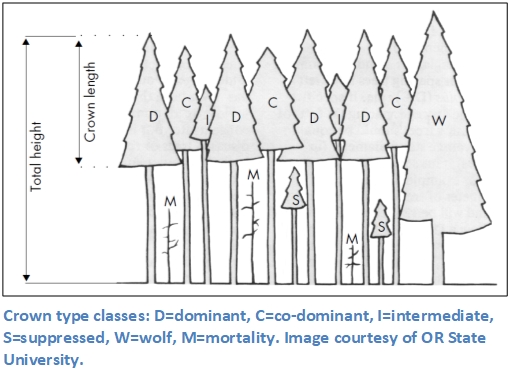
Trees that achieve dominance, for whatever reasons – genetics, microclimatic conditions, dead deer at their base, etc. – retain more of their live crowns than less vigorous trees, and grow taller, increasingly exerting a suppressive effect on their subordinate neighbors, whose live crowns gradually diminish. Over time this process of competition leads to trees occupying any one of four common canopy classes, or crown type classes, based on the position of their individual crown in the overall forest canopy: dominant, co-dominant, intermediate, and suppressed. .
Once a tree’s crown has diminished to below 30% of its total height its ability to photosynthesize – produce carbohydrates and thus cellulose/ wood volume – quickly dwindles. So this presents one of the most crucial variables I consider when deciding when a stand should be thinned – what is the average live crown ratio (LCR)? I don’t look for a literal average across the stand, however. Generally speaking, for a stand to remain in an optimal growth phase, at least 50-60 percent of the trees should retain at least 35% – 40% of their live crowns. These will typically include the dominant and co-dominant trees, as well as some of the intermediate trees, depending on how long the stand has been in competition. Once a tree’s live crown diminishes below 30% of its total height, the growth of the tree begins to shut down and it may eventually succumb to suppression mortality beneath the canopy of the more dominant trees. As live crowns diminish across an entire stand, overall growth rapidly declines and surviving trees grow lean and tall, reaching for the sunlight.
As I walk through this Douglas-fir plantation and segregate the dominant and co-dominant trees (which comprise about 50% of the total stocking density) from their subordinate neighbors, I can see that their live crowns exceed 35-40 percent, indicating that they are still capable of relatively robust growth. Live crowns on the intermediate trees vary, but hover around 30 – 35 percent. Trees with ample crowns are likely still putting on decent growth, but growth on the trees with crowns below 30 percent is likely slowing down dramatically. The suppressed trees with less than 30 percent live crowns are likely just sitting there, either waiting to die from canopy competition, or praying for the day when their dominant neighbor blows over and they can catch a glimpse of sunshine and maybe the future ahead.
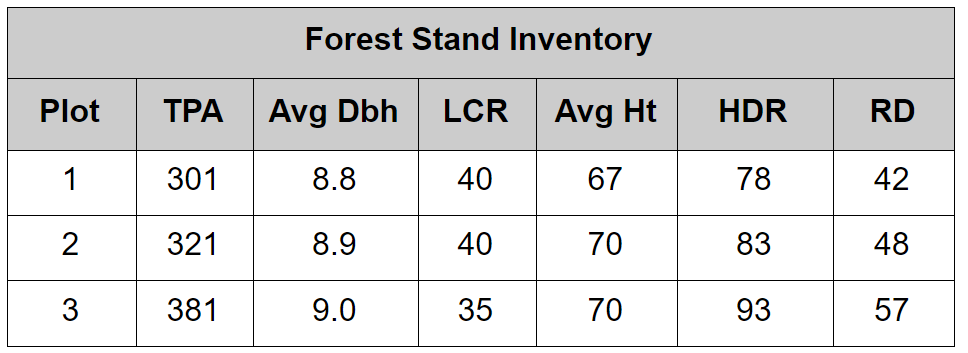
If a stand remains in a highly competitive growth phase for too long, the trees can develop an excessively high height-to-diameter ratio (HDR). A tree’s HDR is calculated by measuring the tree’s diameter in feet, then dividing the tree’s total height (also in feet) by its diameter (HDR = Ht/DBH). It is generally understood that if the average HDR across a stand is >80%, the trees are growing excessively lean and tall, with skinny, brittle stems that may become increasingly vulnerable to storm damage. In the most recent plot I installed in this stand, the average height was 70 feet and the average DBH was 9.0 inches. This translates to an HDR of 93% – significantly exceeding the 80% threshold and indicating a stand that would benefit from thinning.
Stocking Density, Diameter, and Relative Density
Inevitably my eyes descend from the canopy of the forest and I’m now struck by the stocking density of the stand – how many trees are there crowded together across a given area? Stocking density is most easily measured in Trees Per Acre (TPA) and can quickly be determined by counting the number of trees within a standard radius. For instance, the most common plot size I use when conducting a forest inventory is a 1/20th-acre plot, which is 26.3 feet in radius. If you count all of the trees within 26.3 feet of a given point (aka plot center) and multiply the number by 20, you arrive at an estimate on how many trees there are per acre if that plot were representative of the stand. For instance, in the latest plot 1/20th-acre I installed in the Douglas-fir plantation I counted 19 trees, which extrapolates to 380 TPA. However, across the three plots I’ve installed so far, the stocking density averages 328 TPA. It should be an obvious conclusion that the more plots you install, the more accurate your estimate of the average stocking density of a stand will be.
As an aside, I consider that this stand was likely originally planted at approximately 350 TPA, or a tree every 10’ – 12’, which is a common planting density following clearcut harvesting. There was clearly a high survival rate across the seedlings given that an average of 328 TPA still remains after nearly 30 years.
While observing the density of trees around me I also notice the distribution of tree diameters. Since this stand has been in a competitive state for several years, the relationship between dominant and suppressed trees is most noticeably expressed through their diameters.
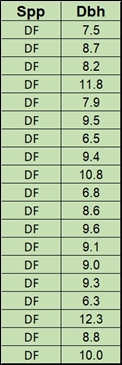
Suppressed trees with diminishing live crowns will not put on as much incremental diameter growth each year as dominant trees. Therefore, it’s a quick and easy process to visually evaluate the percent of suppressed trees in a stand compared to the dominant trees by simply looking at their diameters. In the latest inventory plot I installed, approximately 50% of the trees were in a suppressed growth condition, with diameters less than 8.5” at breast height (DBH). Looking up the stems of these trees I notice their live crowns have receded to less than 30% of the tree’s total height.
The range of diameters of the trees I measured in my recent inventory plot spanned 6.5” – 12.3” DBH. In comparing diameters to live crown ratios, it quickly became apparent that the trees could be grouped a little more simply into three canopy classes based on the following:
- Suppressed: 6.5” – 8.5” DBH
- Intermediate: 8.5” – 10.5” DBH
- Dominant: >10.5” DBH
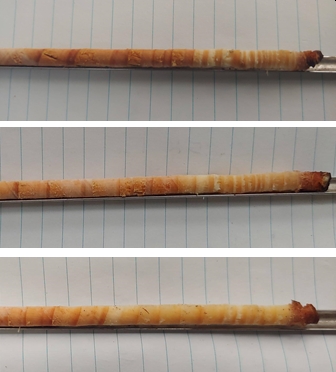
These images show cores from trees occupying each of these canopy classes, descending from suppressed to intermediate to dominant. For the past 10 years the suppressed tree exhibits very slow growth (1.5” DBH). The intermediate tree reveals decreasing growth beginning 10 years ago, but more ample growth over the past three years. The dominant tree shows robust growth until six years ago, several years of slower growth, then an increase again in incremental growth over the past three years. Compared to the suppressed tree, the dominant tree added 3.5” of overall diameter in the past 10 years. However, the slowing growth across all canopy classes of trees is a big clue as to when to thin. I want to keep the most dominant trees in optimal growth, so some thinning will need to occur to reduce competition.
There is a relationship between average diameter and the number of trees per acre referred to as relative stand density. OSU Extension, in their publication Competition and Density in Woodland Stands defines Relative Density (RD) as:
An indication of how fully trees occupy a site. Relative stand density is a measure of the number and average size of trees growing in a stand compared to the maximum possible number of trees of the same average size that the site could support (a biological limitation). It tells us how crowded the trees are and measures the intensity of competition. RD is expressed on a scale of 0–100 percent, where 0 is an unoccupied site and 100 represents the potential maximum density for that species. Maximum density levels vary dramatically between species, but only slightly by location and site for a given species.
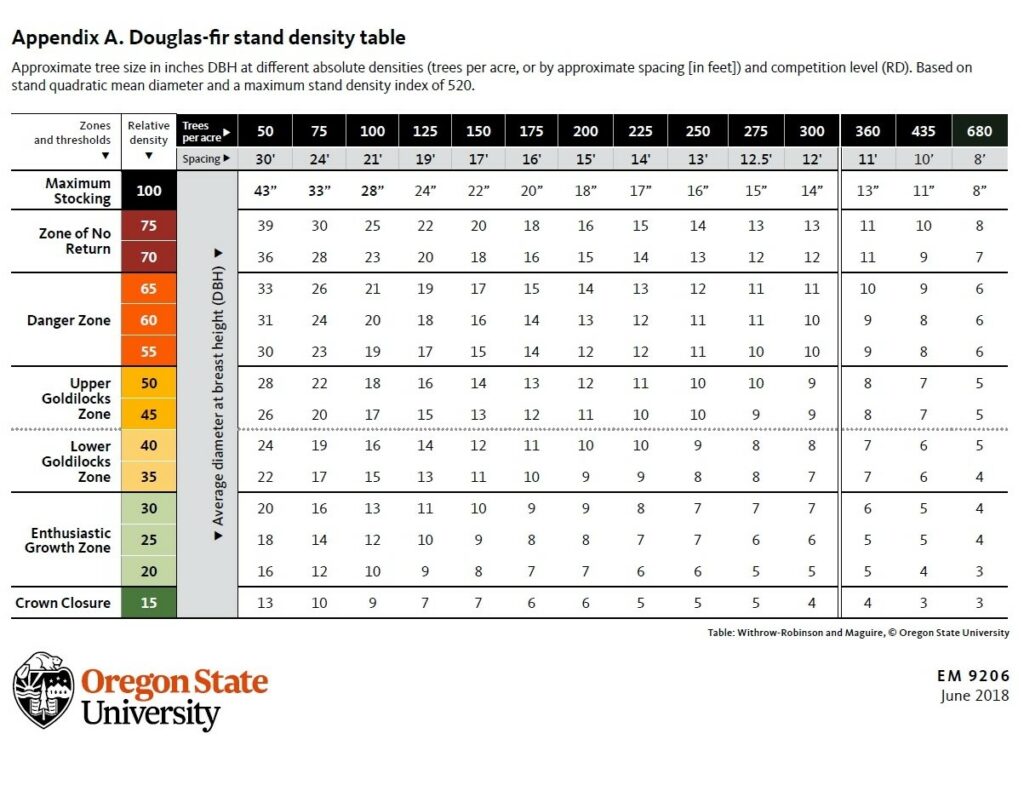
In reviewing the stand density table from this publication (above), I see that with an average DBH of 9” and an average stocking density of 328 TPA, the RD of my stand is approximately 55, or edging up into the “Danger Zone” where increasing competition results in decreased growth and increasing mortality. The high relative density is another clue that it’s becoming time to thin.
What to do?
At this point I think I’ve convinced the biologist in myself that this stand will benefit from thinning if I want to avoid increasing competition-based mortality and stagnant timber growth. Given that I want to retain and improve the growth of the most dominant and highest quality trees, my primary thinning option is from below, meaning first removing the trees suppressed beneath the canopy of the forest. Another handy quality of the RD table above is that you can use it to set a target density for thinning. For instance, if I want to set an average target DBH of 14” – 15” for my second commercial thinning, then I should thin this stand down to about 150 TPA. If the average density of this stand is 328 TPA, this means removing approximately 178 TPA.
So here’s the thinning strategy I’m considering:
- Remove all suppressed trees <7.5” DBH with the exception of a few/acre retained for wildlife.
- Remove the majority of the trees in the 7.5” – 9.0” DBH range, retaining select trees that still have >35% live crowns or have habitat values (e.g. broken or platform tops).
- Thin across the 9.0” – 10.5” DBH range removing any defective trees and spacing residual trees for optimal growth.
- Retain all trees >10.5” DBH unless they have significant defects or occur within proposed forest access roads or landings.
- Retain all hardwoods and minor species, snags, and naturally regenerating understory conifers.
This thinning approach is not strictly from below as I intend to retain trees across the intermediate, co-dominant, and dominant canopy classes. By removing select dominant and co-dominant trees, and generally by opening the canopy through systematic thinning, I should be able to improve the growth of some of the intermediate trees. Harvesting some of the larger trees, and retaining some of the smaller trees will both increase harvest volumes and contribute to more of a complex forest canopy.
Will it Pencil Out?
The question now is, given that the majority of the trees I choose to harvest will be the smaller diameter and most suppressed trees, is there enough volume and value in those trees to make the logging pencil out? Rick’s sage advice to let the stand grow to increase in volume and value is echoing in my head. So I need to run some quick and dirty numbers on the trees I expect to harvest. Here’s my thinking:
- Any tree <7.5” DBH will be sold as pulp with no value back to me as the timber owner (30% of harvest).
- Trees in the 7.5” – 9.0” DBH range will generate one 32’ saw log with a 5” small end diameter (40% of harvest).
- Trees in the 9.0” – 10.5” range will generate one 40’ log with an average 8” small end diameter (20% of harvest).
- Trees in the >10.5” range will generate one 40’ log with an average 10” small end diameter (10% of harvest). Given the height of some of the dominant trees, many can produce two 32’ logs. However, given that some of the trees are defective, I’m assuming they’ll average one 40’ merchantable log/tree.
Using my inventory data, prices from the local Sierra Pacific sawmill near Centralia, WA (November 2020), and the aforementioned thinning strategy, I’ve arrived at the following harvest estimates:
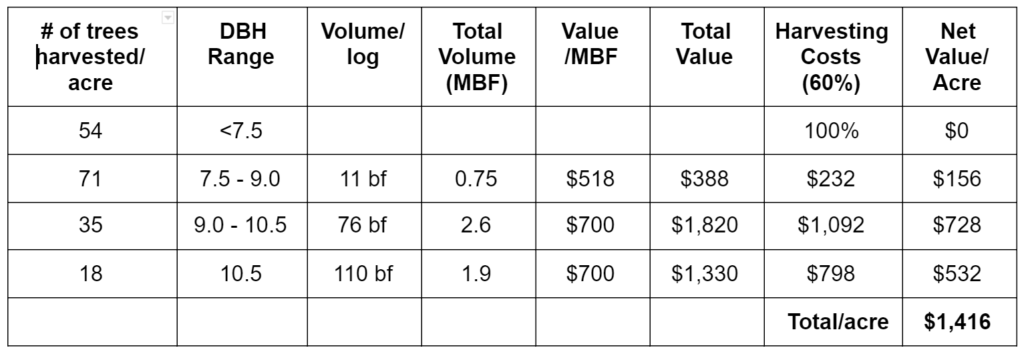
Conclusion
If I want to maintain optimal growth across this stand, then I feel the data I’ve collected leads me to the conclusion that I should thin sooner than later. However, deferring to Rick’s wisdom, if I held off on thinning for a few more years, given the robust growth still occurring in this forest, some of the suppressed and intermediate trees may plump up sufficiently to kick them into a higher value saw log sort and therefore lead to a much more lucrative harvest. If I didn’t need the money, I’d probably let the stand grow for a few more years. However, there are about 10 acres of sparse alder and maple on the wetter slopes below the Douglas-fir plantation that I’d like to rehabilitate and plant back into mixed conifers. That will require clearing the site of the dense brush, removing some of the defective trees, replanting, then controlling the competing vegetation until the planted seedlings reach a free-to-grow height.
Although I may be able to obtain financial assistance through the federal Environmental Quality Incentives Program to restore this area, there likely will still be some out-of-pocket expenses, in particular for maintaining the planted trees. I want to make sure that I have a bank reserve to cover these costs. It’s always been my philosophy to try to get a forest to pay for its own ownership and management costs, so if I harvest next year, I will have sufficient revenue to reinvest back into this property and ensure that all acres that are accessible for long-term timber management are well stocked and growing trees.
Leave a Reply