
The Meaning of Maps
Maps are an essential part of forest management, used to remotely evaluate property, delineate management units, plant harvests, and track management over time. But the array of maps available can be dizzying. Below, we outline a number of the maps you can expect to see in your forest management plan, plus a few more unusual types used in special circumstances.
Aerial Maps
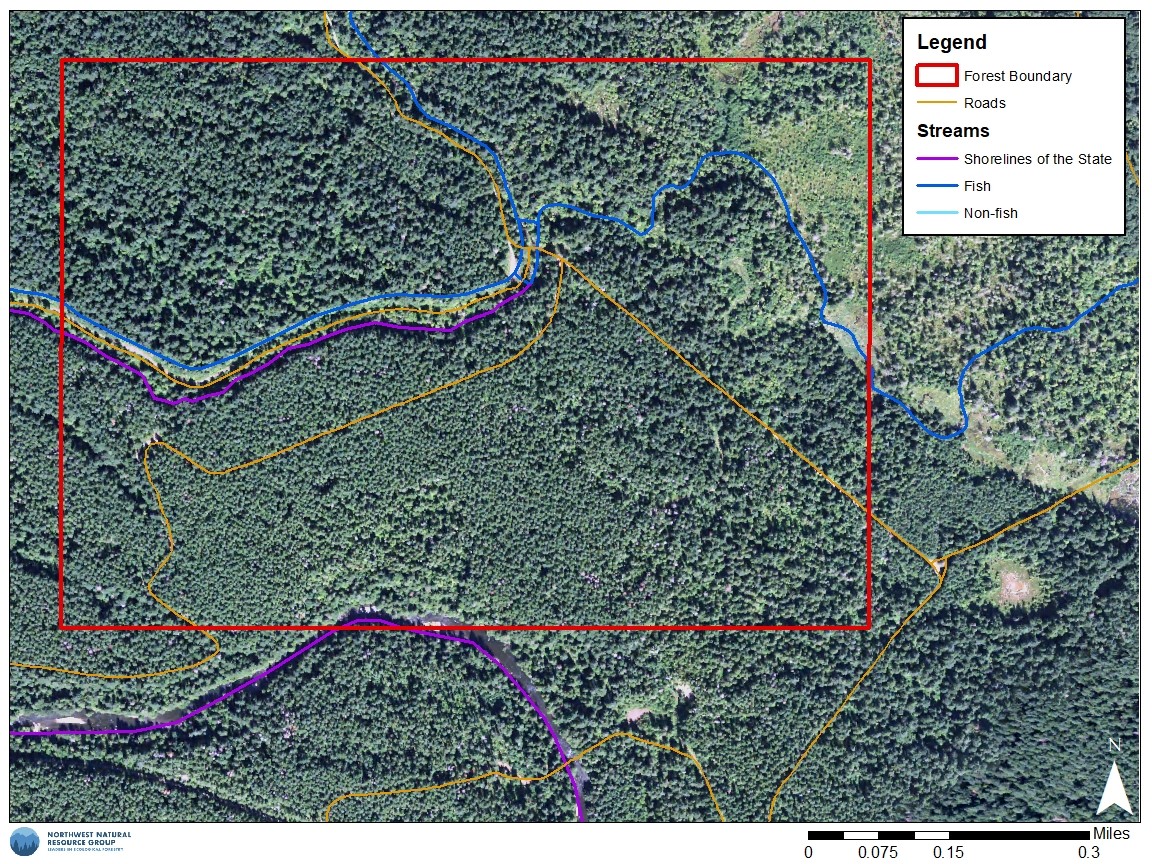
Aerial imagery has been used by land managers for decades. While aerial photos do not yield quantitative values like stand density or average diameter, there are benefits to a simple photo of a stand from above. The biggest advantage of aerial photography is that it has become incredibly easy to collect high quality imagery at frequent intervals (as anyone who has used Google Maps knows). Other datasets are more labor intensive to collect and process. For this reason, they are only updated every few years. Blow down, fire scars, harvest operations and other major disturbances are likely to show up in aerial imagery before they can be seen in LiDAR or any other dataset.
Aerial imagery can also be used to explore the composition of a stand’s canopy. Photos taken in the late fall and winter months reveal deciduous hardwood trees where bare branches stand out against the otherwise evergreen canopy. Even in the summer months, small differences in crown color can show which areas are dominated by hardwoods and which areas are dominated by dark green conifer crowns.
Streams and Hydrology Maps
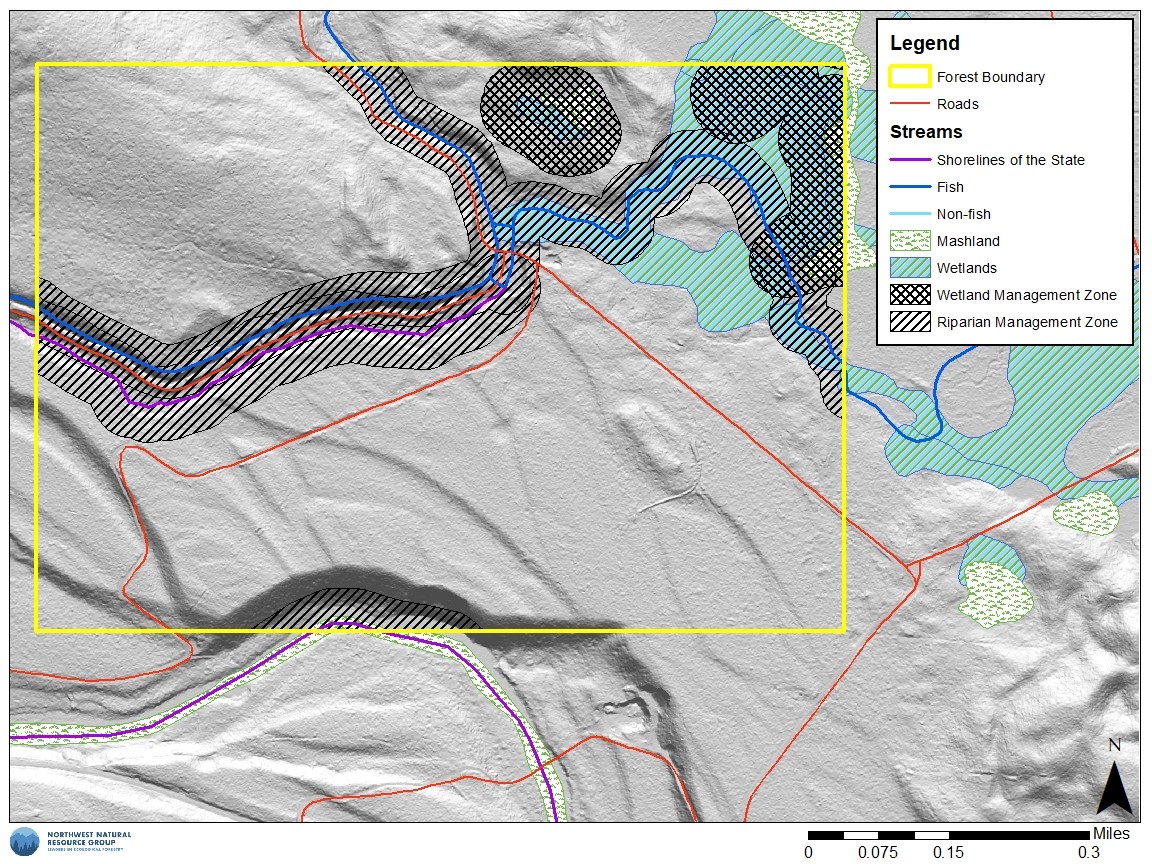
Throughout the Pacific Northwest, streams, wetlands, and other riparian areas have become high priority conservation sites. Riparian areas are important resources for most wildlife species but they are also essential breeding grounds for a number of threatened and endangered fish. Many waterways are corridors for salmon species with immense ecological and cultural importance. Even small non-fish-bearing streams can have large impacts on the health of the larger waterways they feed into. For this reason, streams have an immense impact on the logistics of active forest management. The protective regulations that surround fish habitat and salmon habitat in particular often limit the feasibility of active management projects. Using publicly available datasets like those provided by the Washington State Department of Natural Resources, landowners can determine where streams are located, how large the riparian buffers should be, and what sites are suitable for forest roads.
Soil Maps
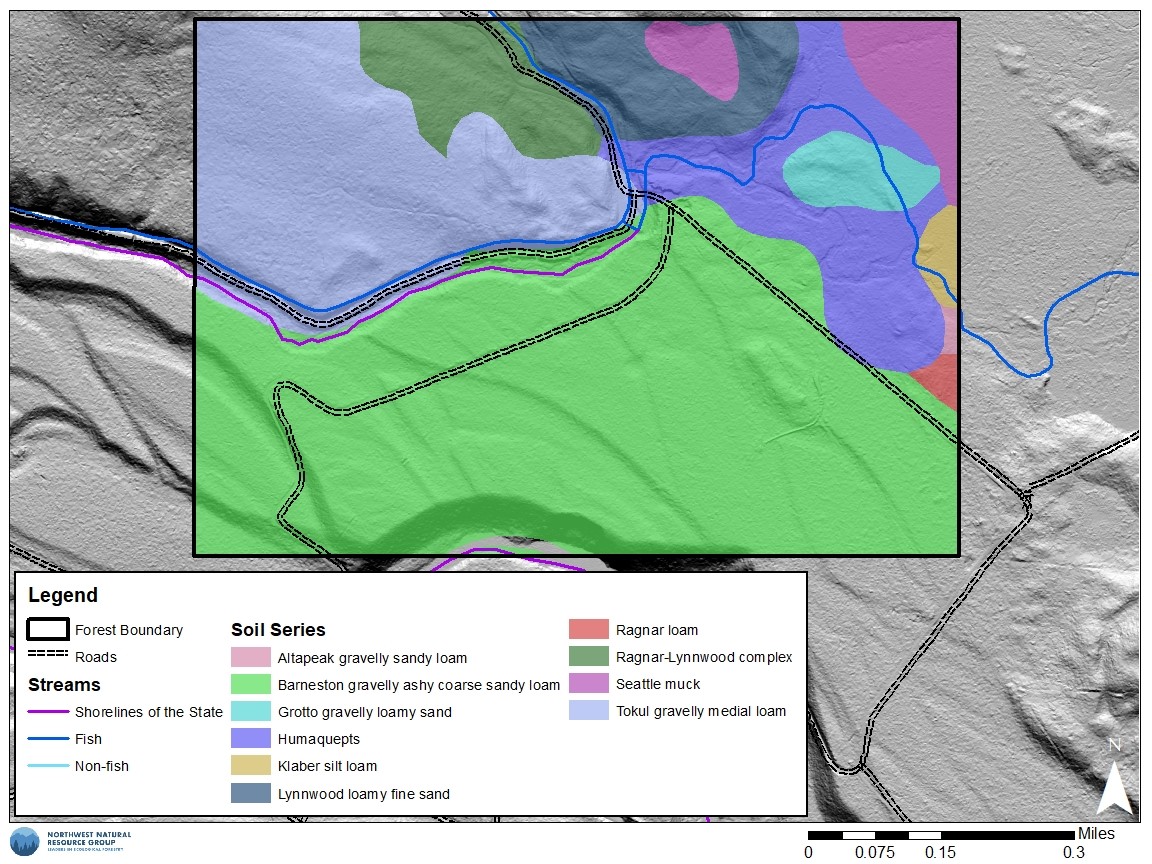
Soils play a major role in determining the composition and productivity of a forest as well as the hazards that may be associated with active management. A soil’s texture (the proportion of fine or coarse particles that make up a soil) determines how much space is available for water, air, and roots. Coarse soils (soils with high proportions of sands or gravel) are incredibly porous. In these soils, water drains rapidly into the subsoil, pooling in aquifers and feeding streams. Large air pockets fill the gaps between particles, and roots can easily penetrate the various soil horizons. However, because coarse soils drain so readily, they are also at increased risk of drought. Sites with coarse soils are often dominated by drought-resistant vegetation such as ponderosa pine, lodgepole pine, Douglas-fir, and Pacific madrone. In contrast, sites with a high proportion of fine materials have smaller pores and drain less readily. In fine soils, water can pool on top of the clays and silts creating muddy patches, seasonal pools, and even wetlands. These soils often host vegetation that is more susceptible to drought such as western hemlock, grand fir, or Sitka spruce.
When heavy machinery, such as harvest equipment, moves across a landscape, the composition of the soil determines how much of an impact this disturbance will have on the forest. Coarse soils are less susceptible to compaction and are therefore less prone to degradation following disturbance. However, fine clay/silt soils readily compress under the weight of machinery and do not recover easily. If driven over when conditions are not optimal, these soils tend to rut, creating pools that increase the danger of future compaction and rutting. On steep slopes, compaction can concentrate the flow of water across the landscape increasing erosion.
Soil maps allow land managers to place roads, skid trials, and log landings on soils that are less prone to compaction. If a forest has a high proportion of fine soils, land managers can use harvest methods that are less damaging to the soil. It is common practice to add plant debris such as branches and tree tops to skid trails in order to buffer them from damage, but in high-risk areas, land managers may choose to restrict harvest operations to the driest months of the year or, when temperatures allow, harvest after the ground is frozen.
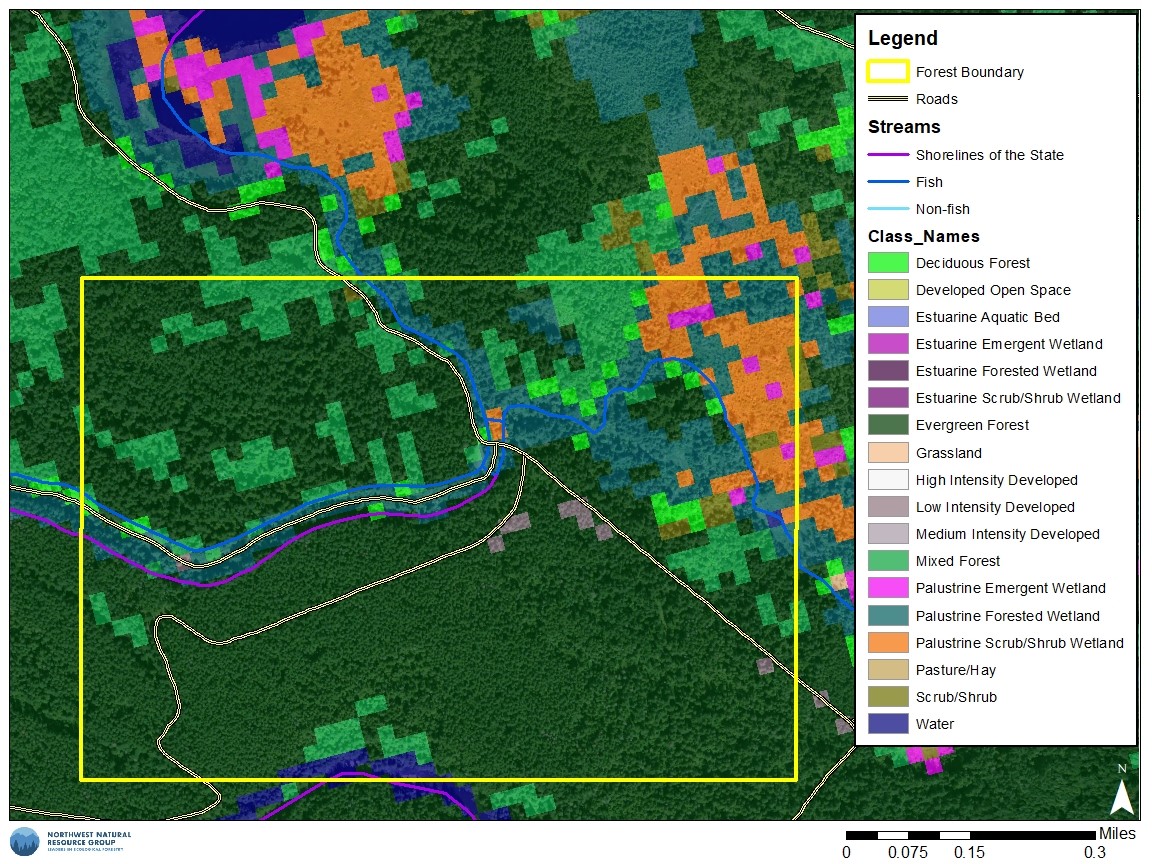
Forest Type
Individual species of plants have a range of shade, moisture, and temperature tolerances that determine which areas they can grow in. Species with similar tolerances are adapted to similar sites and are often found together. Evergreen huckleberry and Douglas-fir for example are well adapted to drought prone soils and little shade. For this reason, they are often found together in the droughty forests east of the Olympic Mountains. Since species associations depend on known environmental factors such as climate and soil composition, it is possible to predict the composition of a forest using remote sensing data and environmental models. These associations form forest types that are mapped on publicly available land cover datasets.
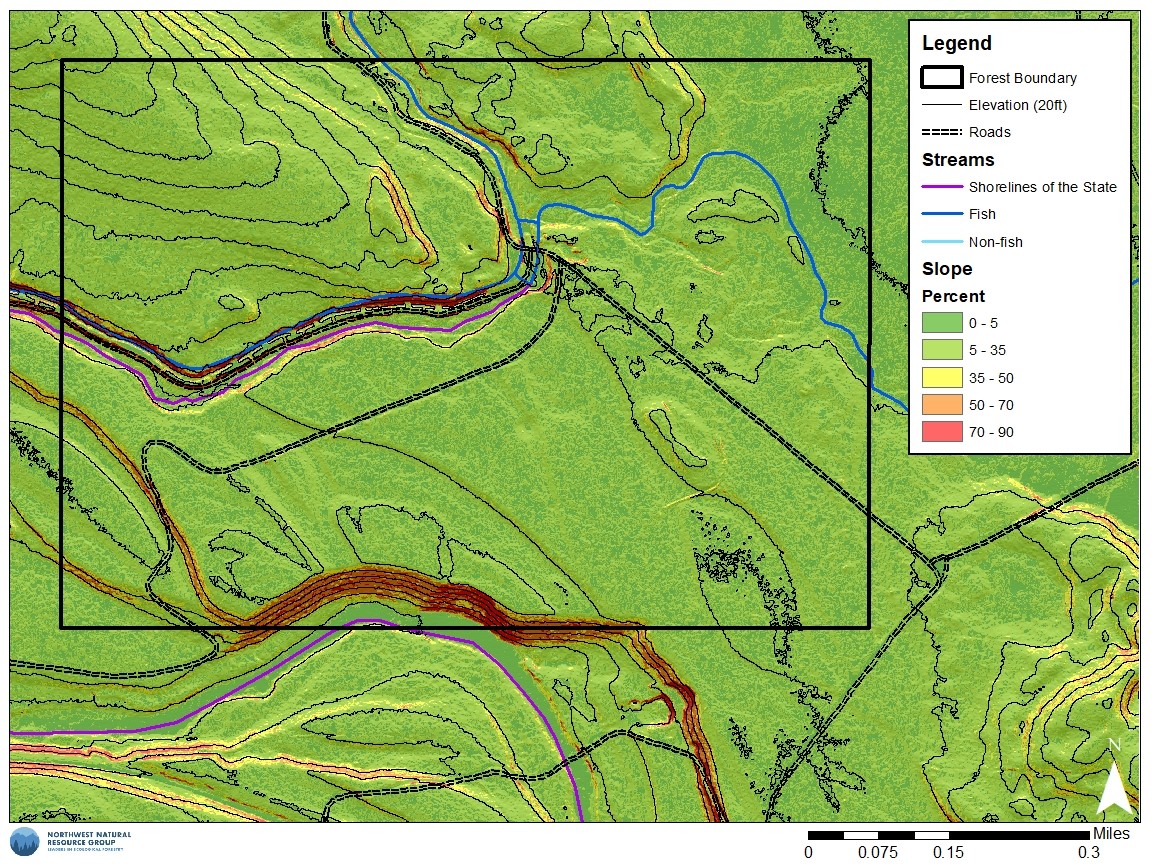
Topographic Maps
Topographic maps are a broad category of maps that may include slope maps, contour maps, or even simple hillshade maps. Topographic maps are created using LiDAR, where pulses of light fired from a small plane are used to model the texture of the earth below. As LiDAR has improved, we have been able to get increasingly accurate models of both the canopy and the surface of the earth below. Topographic maps are then built using the model of the earth’s surface.
Topographic maps help to identify areas where steep slopes and difficult terrain might complicate management of the overstory. Slopes greater than 35% are difficult to harvest with ground based equipment. Areas with sustained slopes over 50% require expensive cable or helicopter logging. Perhaps most importantly, topographic maps can reveal signs of slope instability including concave slopes surrounding springs and the scars of old landslides. Topographic maps can also help to identify old forest roads and log landings that can save time and money during harvest operations. Where no roads or landing exist, topographic maps can help to find a suitable location for heavy equipment to process logs and remove timber.
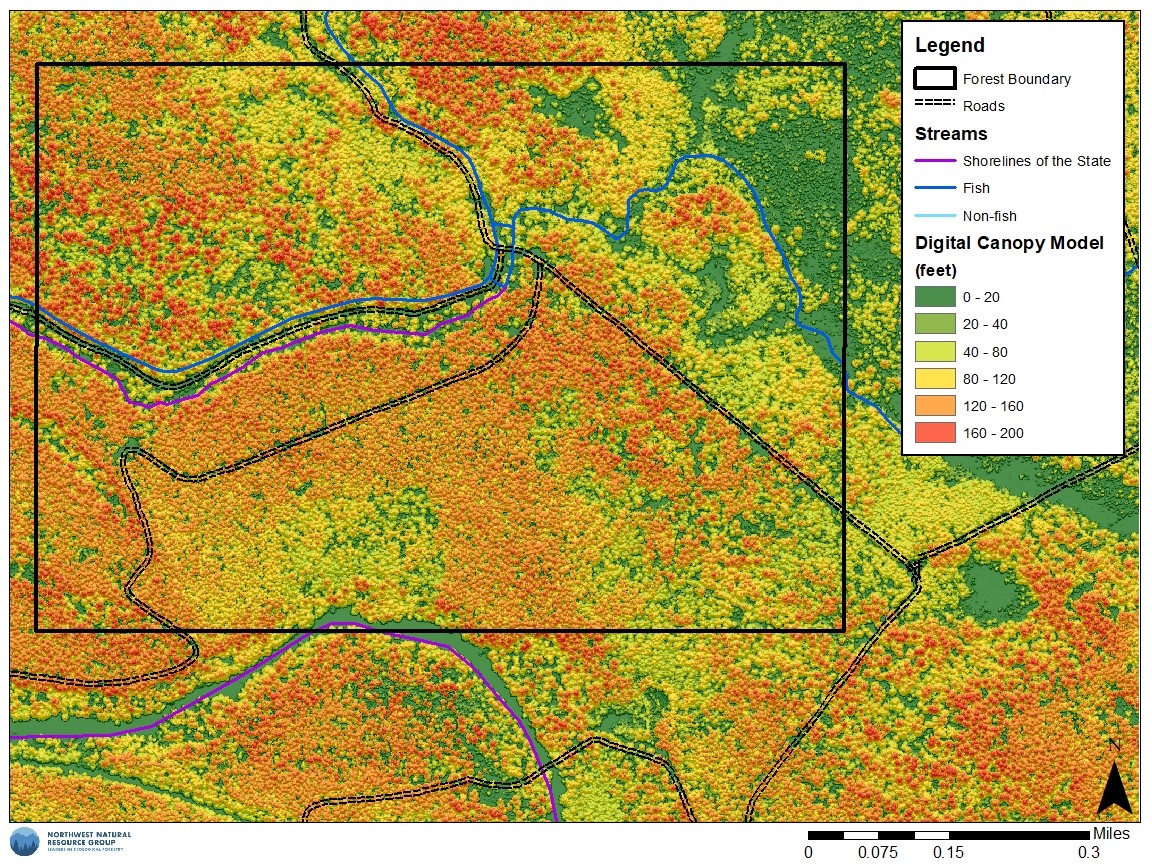
Canopy Maps
As mentioned above, LiDAR captures both the surface of the canopy, and the bare earth below. Using both datasets, we can determine how much higher the canopy is when compared to the earth, effectively revealing tree heights throughout the forest.. Highly accurate LiDAR is now readily available, allowing the canopy height model to identify individual trees in the canopy. This map is an excellent resource when navigating the forest, but is also a valuable tool for management planning.
A canopy height model can be used to roughly estimate many stand characteristics that are not visible on other maps. Tree height can be a proxy for other, more useful attributes such as diameter and age. The areas with the tallest trees are generally older than the areas with shorter tree heights. Larger tree heights generally correlate with larger diameters and greater total timber volumes. The canopy height model can also be used to assess the structure of the forest by evaluating the consistency of the canopy. While it may not be practical to draw quantitative estimates of trees per acre or basal area, it is easy to see that some areas have dense tree cover while others have more gaps between dominant individuals. In combination with field data, the canopy map is a good resource for designating stand boundaries and lumping similar forest types together.
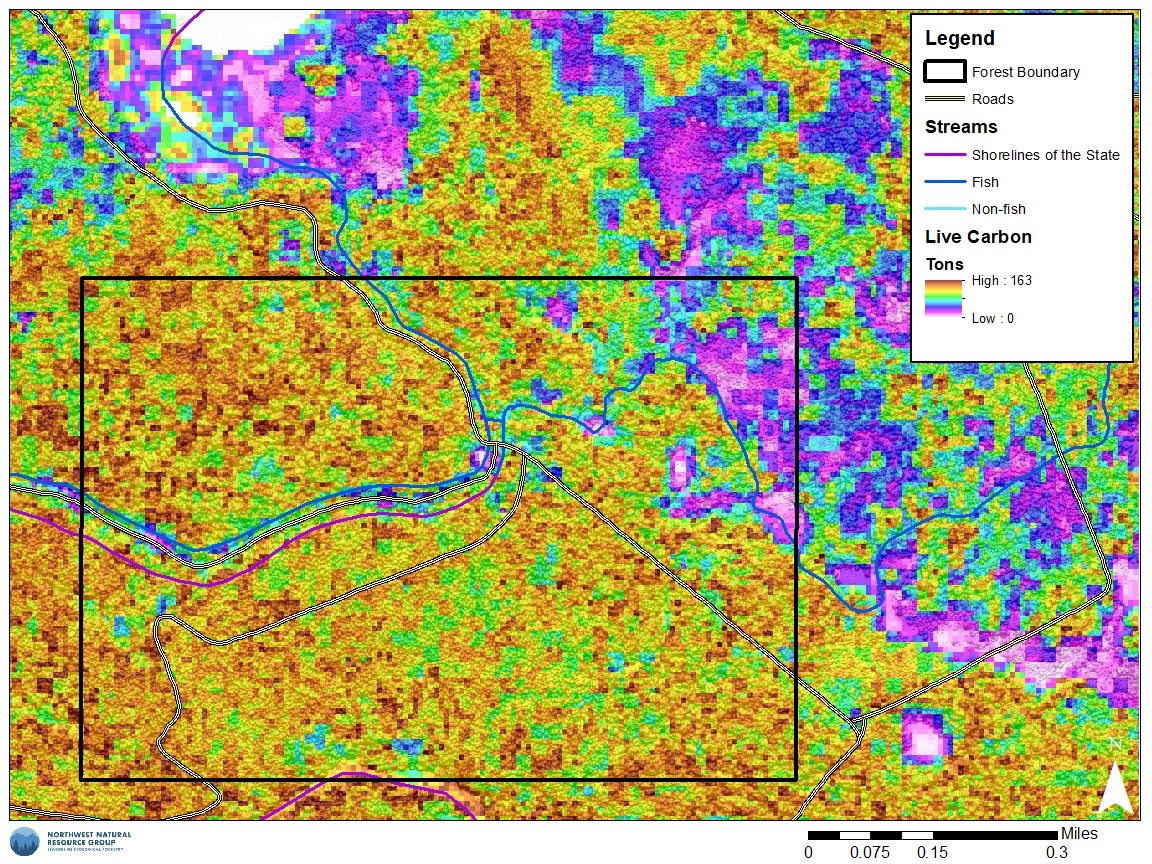
The maps above are those most commonly used by landowners and included in forest management plans. However, there are many other types of maps that may be used, such as those that focus on stocking, carbon, or canopy cover. It all depends on the type of management that is being done, and what information needs to be on hand for managers to be able to make good stewardship decisions.
Leave a Reply